Forecasting the Volatility of Altcoins
We put forward a model implementation for unbiased forecasts of cryptocurrency volatility. The model provides a familiar breakdown between common and instrument-specific sources of variance. Within the common factors, we attempt to build a digital asset-specific multi-factor framework. We also incorporate an autoregressive adjustment to account for heteroskedasticity in daily returns. The model performs well over its short history and can be used for construction of diversified token portfolios.
Covariance of Token Return
Cryptocurrency returns exhibit a high degree of correlation to one another and there are large differences in the level of volatility of the different tokens. These differences are mostly persistent over time.
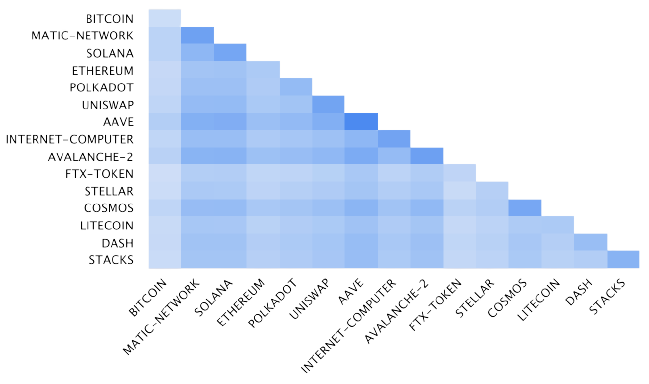
Covariance Matrix of Daily Returns
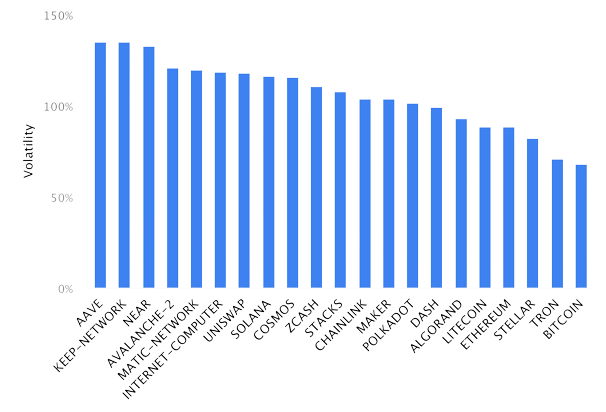
Annualized Volatility of Daily Returns
We estimate a model that decomposes the covariance matrix of the top 200 tokens between common and residual variance in the form:
Sources of Correlation
Systemic Risk
To capture a measure of systemic risk in crypto market, we construct a quarterly rebalanced index of market cap weighted token. This approach recognizes the large importance to Bitcoin as a proxy for systemic risk in crypto, while still capturing diversification benefits of allocating to Altcoins. The index most closely resembles the Bloomberg Galaxy Crypto Index.
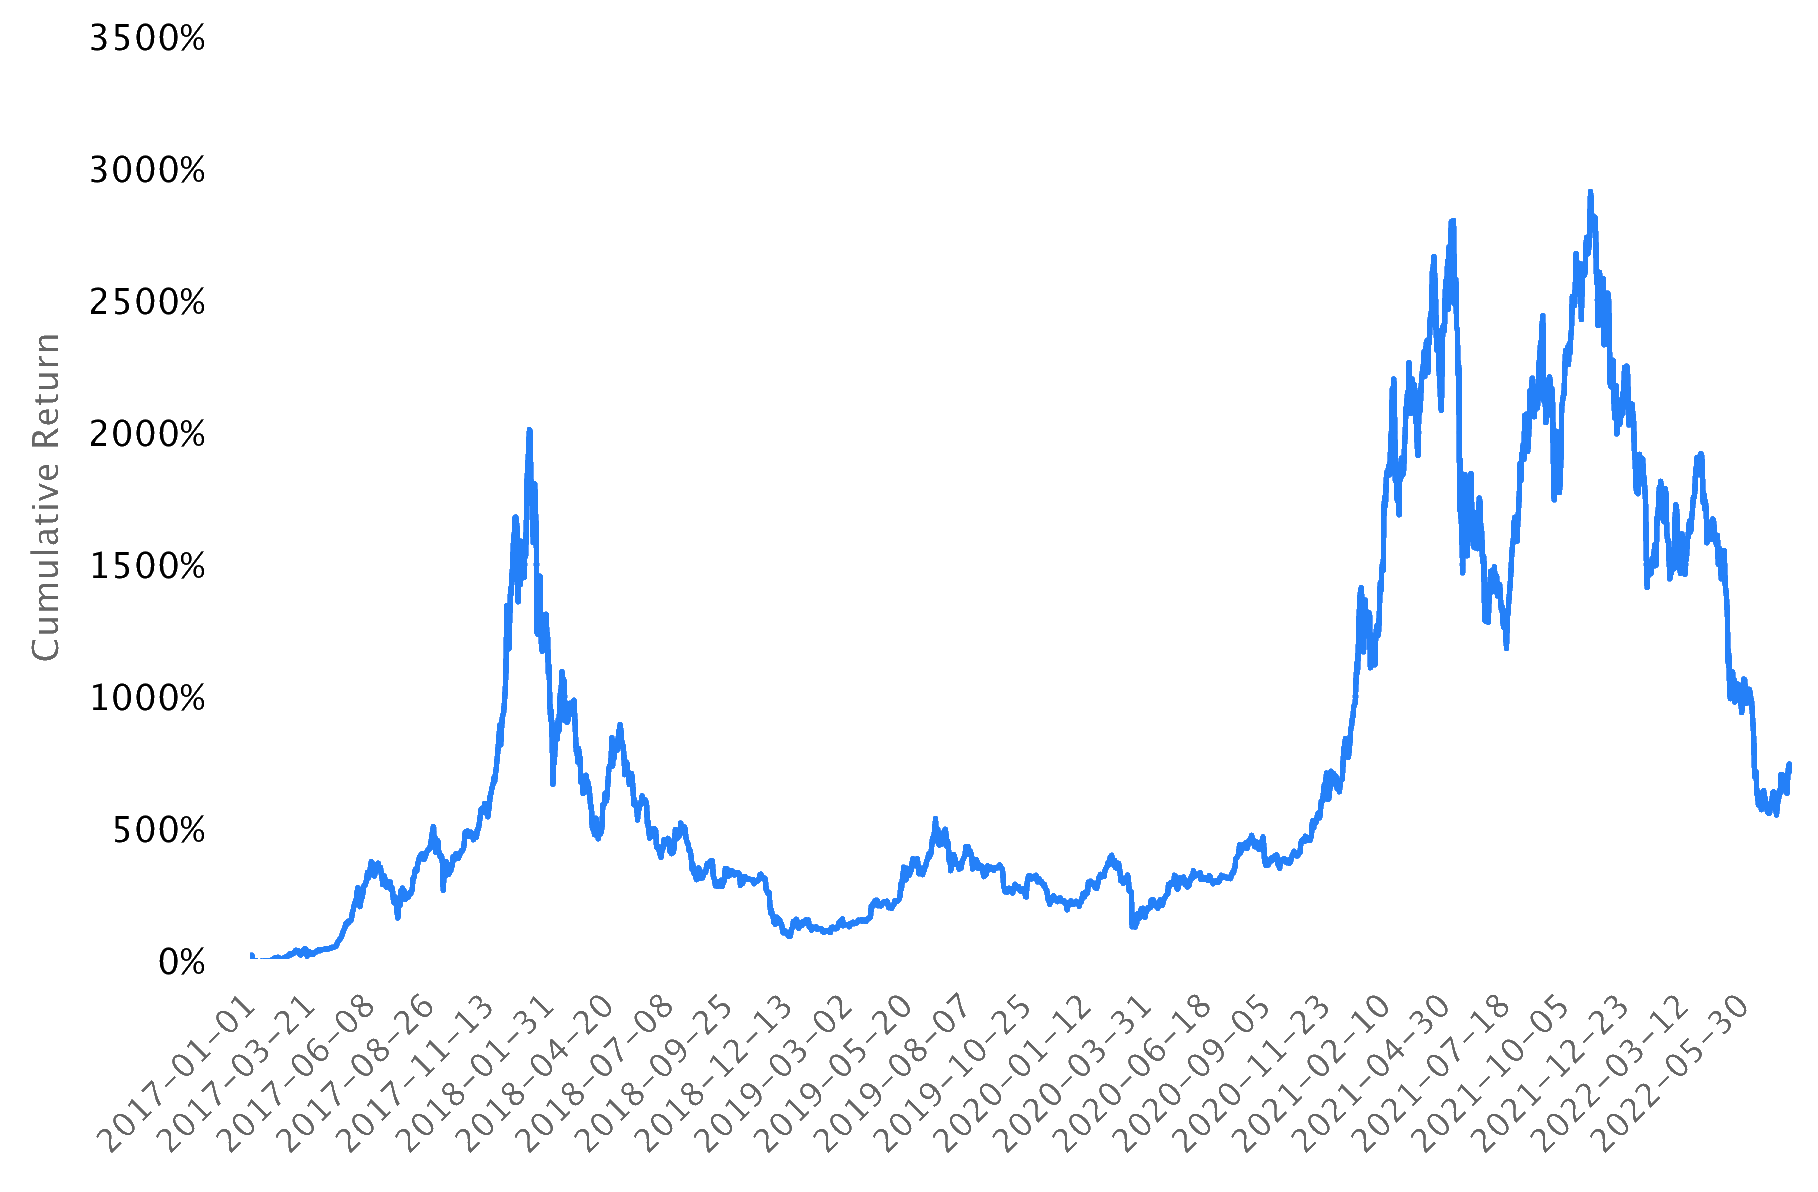
Market Benchmark Return
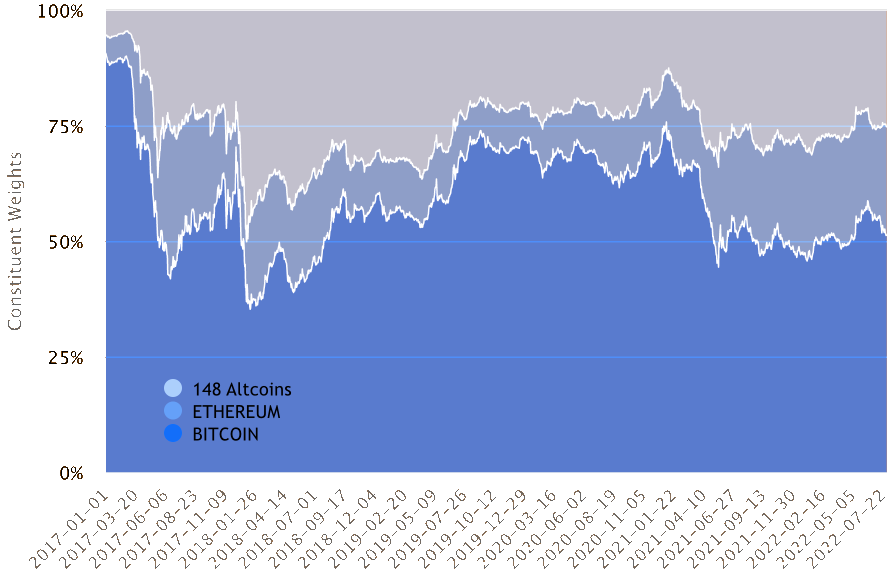
Benchmark Constituents
Crypto Sectors
After accounting for systemic risk, there are still observable co-movements in token returns. The most evident is related to tokens with common “use cases” – or equivalent to “sectors” in the stock market.
We classified cryptocurrencies into a fundamental taxonomy that grouped tokens by value driver. From that classification we constructed several sector factors and retained the ones that displayed then most robust data quality for a sufficiently long history.
These common factors together account for roughly 50% of token variance.
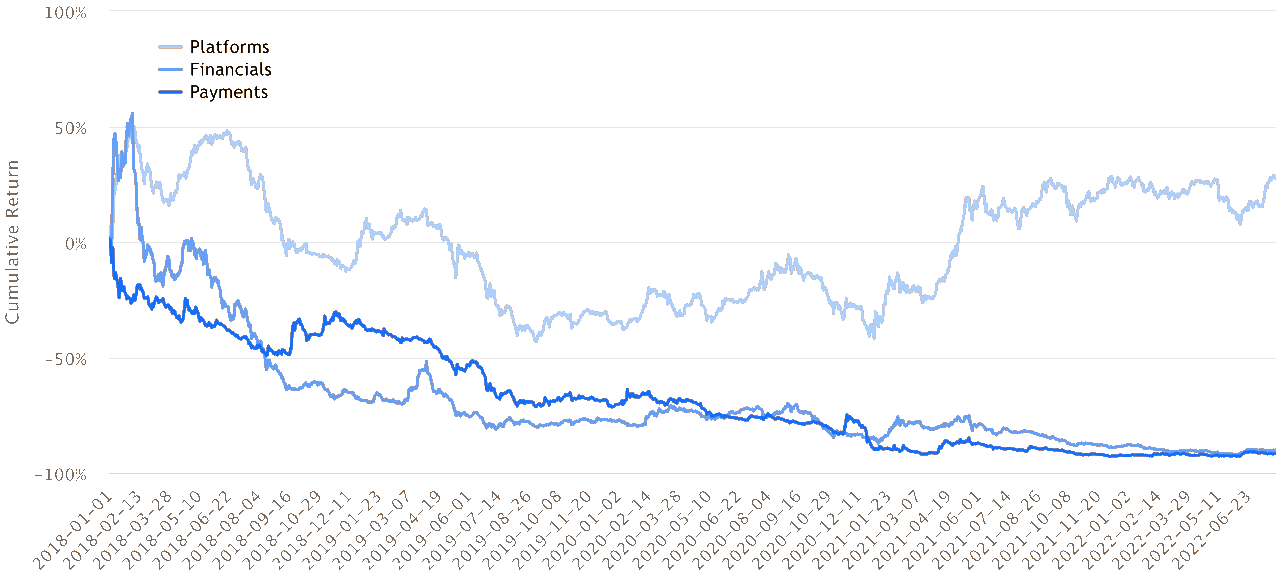
Sector Returns (Net of Benchmark)
Conditional Volatility in Crypto
There’s a vast literature on conditional volatility models for digital assets. The autoregressive behavior of daily returns is still very much in place at the time of writing and so we’ve accounted for this in the model estimation.

Token autocorrelation from 2018 to 2022
Model Performance
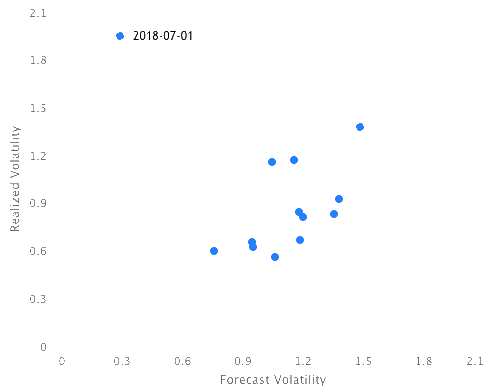
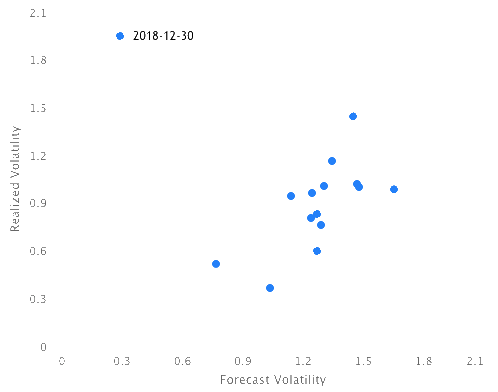
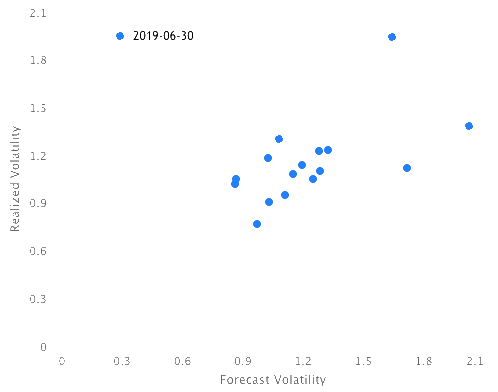
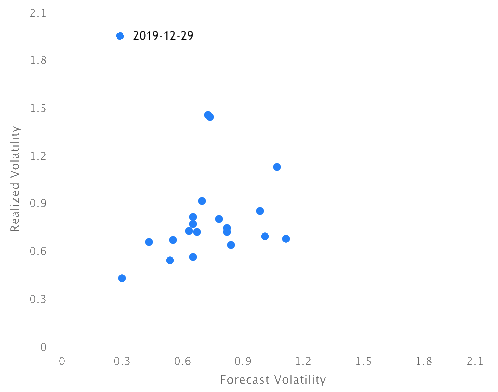
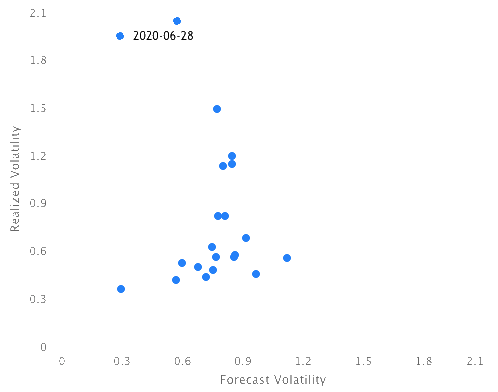
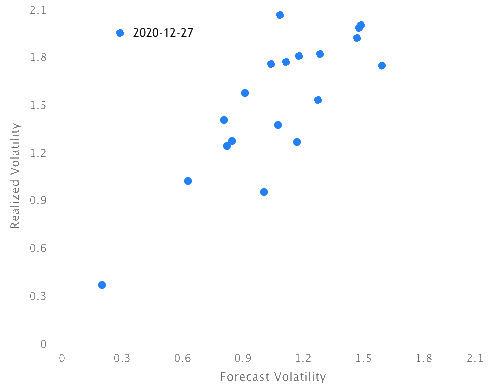
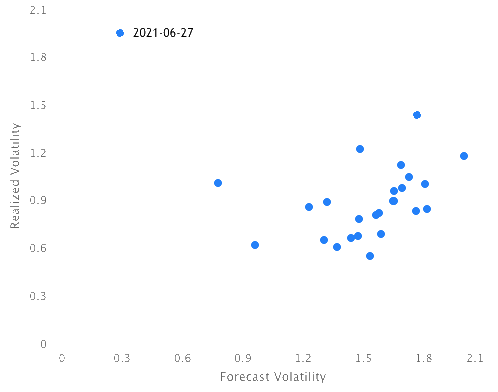
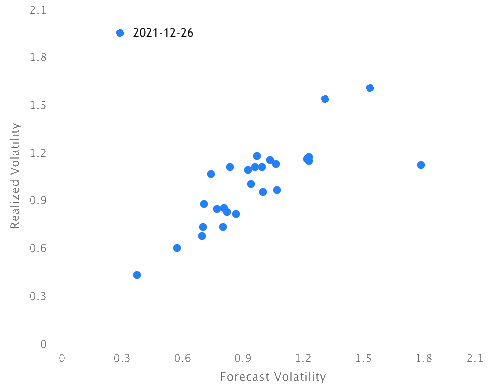
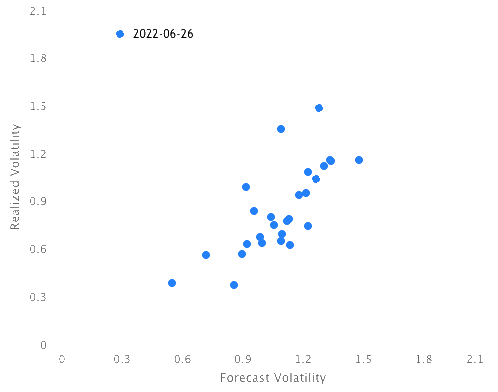
The model provides an unbiased estimation of crypto volatility, even over the recent downturn.
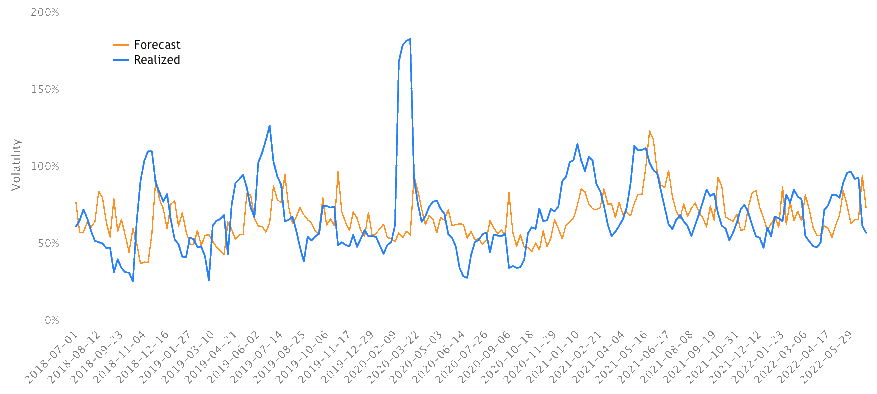
Bitcoin Volatility
On average the model explains 56% of the cross-section of token volatility over the last 4 years.
Estimated Model via API
QIS Risk provides model parameters via an easy-to-use API. We also make this data available as flat file for rapid backtesting. Contact us on support@qisrisk.com for a data export.
Further Reading
Smales (2020) One cryptocurrency to explain them all? Understanding the importance of bitcoin in cryptocurrency returns
Shah et al (2021) Principal component analysis based construction and evaluation of cryptocurrency index
Dyhrberg (2016) Bitcoin, gold and the dollar – A GARCH volatility analysis
Liu et al (2019) Factor Structure in Cryptocurrency Return and Volatility
Ardia et al (2018) Regime changes in Bitcoin GARCH volatility dynamics
Corbet et al. (2017) The influence of central bank monetary policy announcements on cryptocurrency return volatility
Aras (2021) Stacking hybrid GARCH models for forecasting Bitcoin volatility
Frances et al (2019) The cryptocurrency market: A network analysis
Bhambhwani et al (2020) Blockchain Characteristics and the Cross-Section of Cryptocurrency Returns

